This article was originally published by Tyler Durden at ZeroHedge.

What happens next?
It’s official: as of this moment, the US economic expansion is now the longest on record, entering its 121st month since the end of the 2009 recession (which according to the NBER ended in June of that year), and surpassing the previous 120 month record – the March 1991 – March 2001 expansion – which ended with the bursting of the dot com bubble.
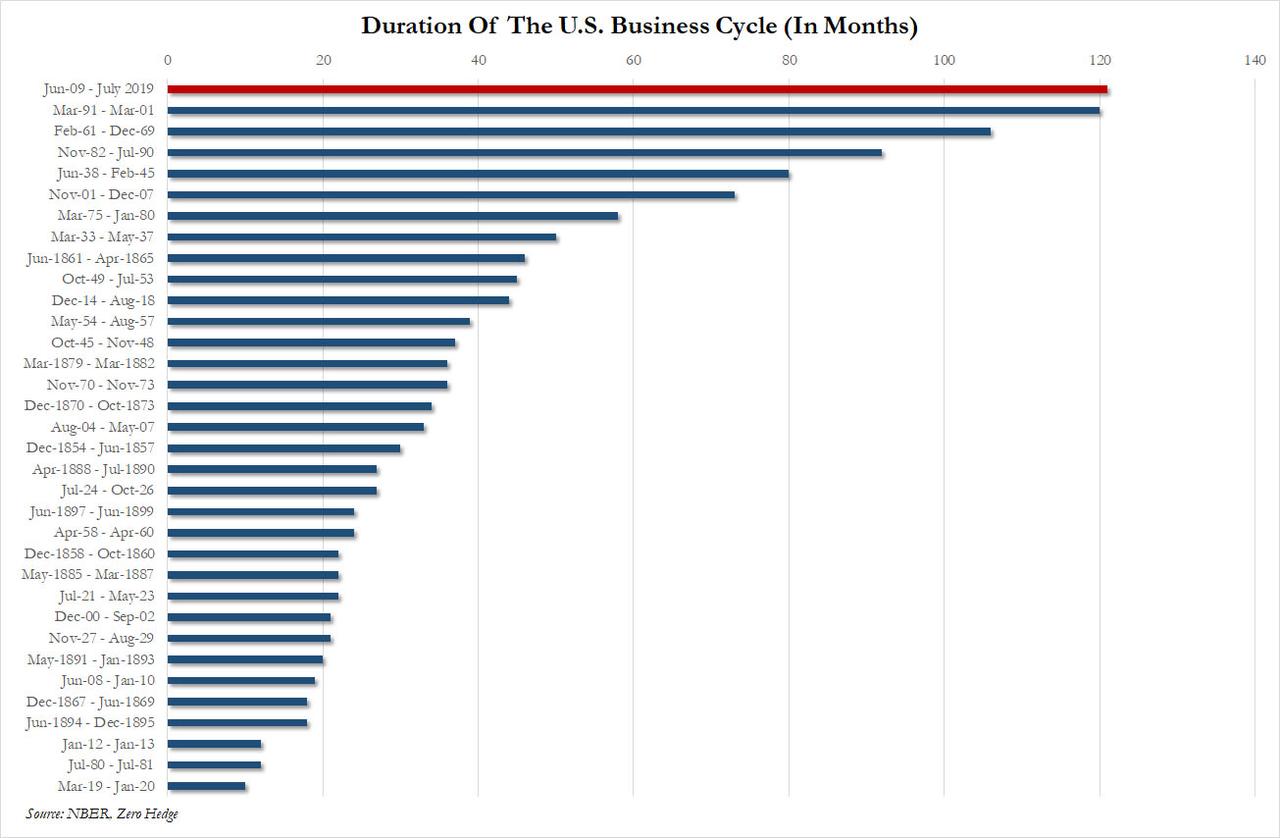
As Deutsche Bank’s Jim Reid writes, since US business cycles have been tracked from 1854 there have been 34 expansions. The last four have all been long relative to the past and are all in the top six in terms of duration. The other two in this top six were the June 1938-cycle which was boosted by the WWII rearmament efforts, and the Feb 1961-cycle where the Fed was late to deal with ever-increasing US inflation, leading to too loose monetary policy and an extended cycle.
As part of a recent analysis, Deutsche Bank explains why this cycle – and the past four – have been so long relative to history, show various economic and market indicators from this cycle relative to the past to put the record-breaking expansion in some context, and predict what may happen next.

It may come as a surprise to exactly nobody, that there is a distinct correlation between the rising length of the US business cycle – and ensuing economic and market crashes which terminate said expansion – and the advent of the Federal Reserve. Oh, and globalization has a lot to do with everything too.
But first, a quick stroll down memory lane…
As Deutsche Bank writes, during the earliest monitored business cycles, the US economy was predominantly agriculturally based. Indeed the share of employment made up from this sector was 59% in 1850 and only dipped below 30% by 1920 and below 10% by 1960. This likely made GDP more volatile as the economy was more exposed to the boom and bust crop cycles without much sector diversity. In addition, prior to 1913, there was no central bank and banking runs and panics were a fairly regular feature of the economic landscape.
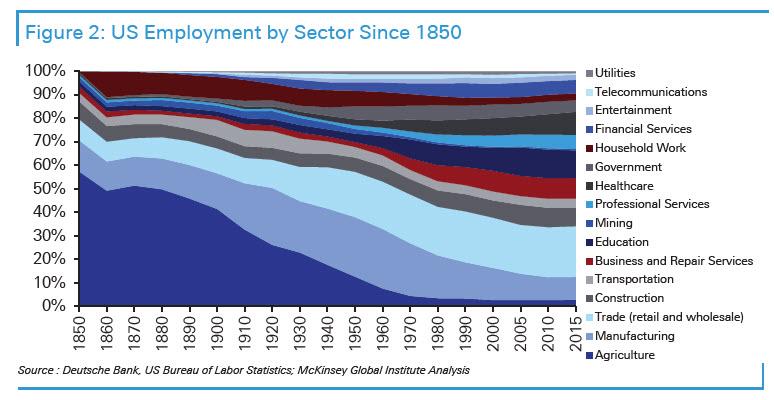
As the economy became more diverse and less dependent on agriculture and the Federal Reserve appeared in 1913 and became increasingly more active in the economy and capital markets, economic cycles were able to be extended. However, WWI and its aftermath, the stock market crash, the 1930s Depression, and the fact that the US operated under a gold standard ensured that cycles were still relatively short by modern standards until at least WWII.
The gold standard and subsequent Bretton Woods system (1946-1971) restricted stimulative policy (both fiscal and monetary). The dollar was convertible into gold at a fixed price and policy had to ensure that there wasn’t a run on gold reserves.
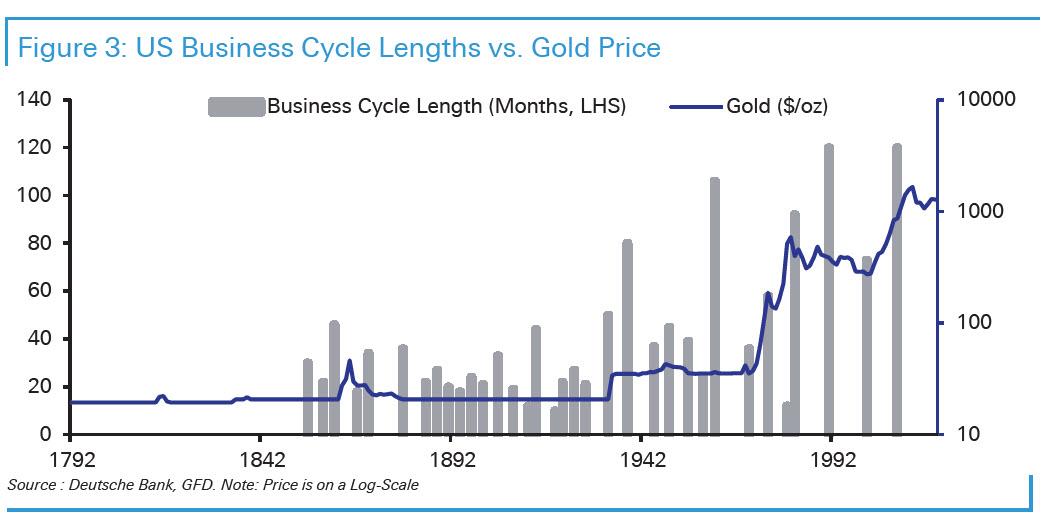
Amusingly, indirectly summarizing the current economic and market climate, Deutsche Bank writes that back int he day, “loose fiscal or monetary policy to extend a business cycle would have likely led to the perception that the authorities were prepared to generate inflation and erode the value of the dollar.” Which, of course, is the current situation, only it’s not just the US that is doing it, but everyone is. In any case, when this happened during various points in the past, gold would have flowed out of the country threatening the economic management model of the time. The chart below shows the price of gold to the USD alongside the length of each business cycle and suggests that business cycles were a lot shorter when the dollar was rigidly price fixed against gold. As the ties slowly loosened to gold – culminating with Nixon closing the gold window on August 15, 1971, and effectively ending the Bretton-Woods system – and devaluations occurred, business cycles started to get longer.
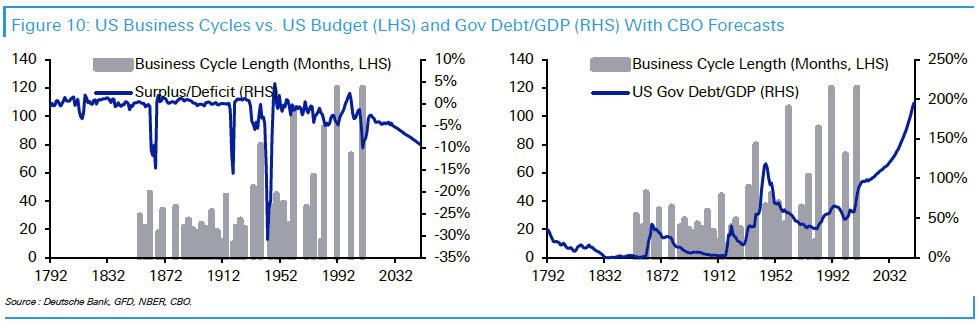
It’s worth noting that as the ties to gold were loosened, economic policy could become more flexible – think more and more debt – allowing the “opportunity” for more stimulus. Deutsche Bank shows this by highlighting the length of each US business cycle but this time with the annual US budget deficit (left) and total Government Debt to GDP (right) overlaid on top. Bottom line: with the US dollar becoming unanchored from gold in the 1970s, it allowed every successive administration to avoid recessions by piling up more debt and spending at an ever faster rate.

What may come as a surprise to several generations of Americans is that prior to the late 1960s, the US ran close to a balanced budget every year outside of wartime and the Great Depression. Deficits temporarily ballooned and debt increased on these occasions and membership of the gold standard was often suspended allowing for more flexible policy for a brief period of time. However, the US quickly went back to balanced budgets after these events alongside a stable gold/USD parity which made it very hard to be overly stimulative.
Pressure on this system started to build as the post-WWII landscape emerged, leading to structural deficits slowly building up in the late 1960s. There was huge population growth in this era and at the same time, we saw the birth of the welfare state and “great society” type movements. Across the globe, citizens were increasingly demanding more access to education, healthcare, a safety net for the poor and unemployed, better public services, and the increased provision of state pensions. This led to increased demands for governments to spend more and this was funded by deficit spending across the world, a trend that lasts to the current day. Very few countries have managed to balance their fiscal books over the last 50 years.
Of course, this new trend was not sustainable in a precious metal currency system and eventually, the increases in US/global deficits put pressure on the Bretton Woods system. In 1971 President Nixon suspended the convertibility of dollars into gold and the US moved to the fiat currency regime that is still in existence today. At that point, the vast majority of global currencies – that had been fixed to the USD in the Bretton Woods system – also effectively became fiat currencies.
As currency ties to gold broke around the globe, cycles started to get longer but debt started to increase – a pattern that has extended to the current day with the added kicker in this current cycle being the largest round of central bank balance sheet expansion in history in the US, and at a global level: i.e. the entire world is now all in on avoiding a recession, and the cost is the greatest accumulation of sovereign debt in history.
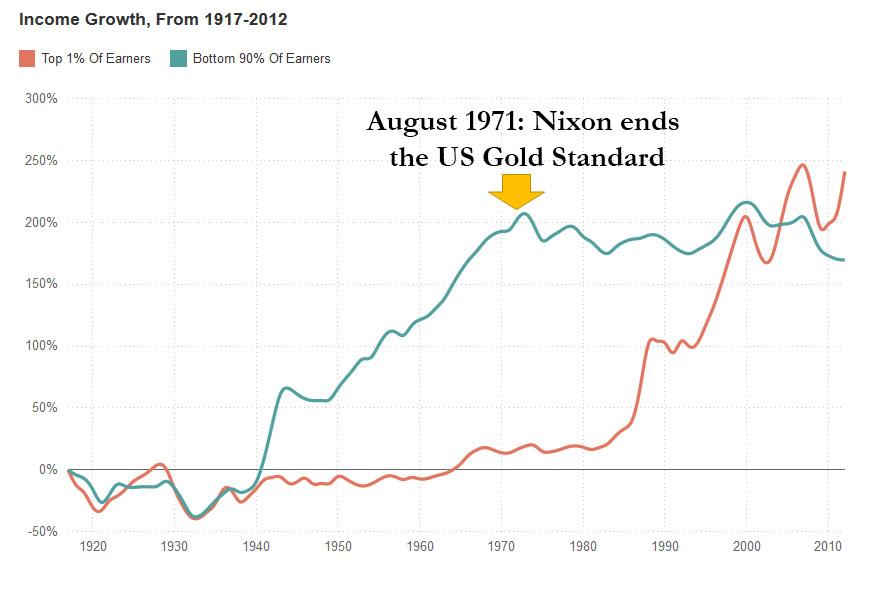
Incidentally, as we showed back in 2015, the end of the US gold standard in 1971 in addition to permitting ever longer economic cycles (at the expense of record debt), also marked the moment when the US middle class stopped growing, as the income of 90% of the US population ended its ascent, while unleashing a golden age for the US “top 1%”, whose asset holdings exploded in “value” at the time the USD was delinked from gold. Which, incidentally, is the solution to the nationalist problem in every developed nation – if you want the middle class to return, and income for the vast majority of the population to increase, all that has to happen is for the gold standard to return. Of course, since that means crippling the wealth of the top 1%, it will never happen.
 Obviously, the start of this new era (the 1970s), in which fiat currencies emerged as ties to gold were broken, saw great economic challenges with high inflation and the oil shocks ensuring that managing the business cycle was still very difficult. Nevertheless, as DB’s Jim Reid notes, it was interesting that the first full cycle of the post-Bretton Woods era starting in 1975 ended up being the third longest on record at the time (out of 29), behind only the 1938- WWII rearmament cycle and 1961- Fed policy error cycle.
What about the Fed?
The next chart shows the Fed Funds rate over the last century with recessions marked. In the Post WWII period, the interesting thing is that there have been two long rate ‘super-cycles’. The first extended from the end of the War until the early 1980s and saw rates structurally head higher across multiple cycles. During this period there were regular recessions with only the 1960s cycle an extended one due to what is now widely believed to be a policy error from the Fed as they failed to hike rates fast enough to control inflation. Rates eventually peaked just before the start of the long cycle era and since then they’ve been on a near four-decade reversal of the 1945-1982 trend. So in the former period, the Fed was in a long hiking super cycle which would have helped contribute to multiple recessions in that period. The opposite was true post-1982 where the structural ability to cut rates must have elongated cycles that might have otherwise been prone to roll over. This, as Deutsche Bank notes, undoubtedly played a part in the move from short to long cycles.

All of this worked great… until the Lehman failure and the global financial crisis unleashed a deflationary shockwave across the globe.
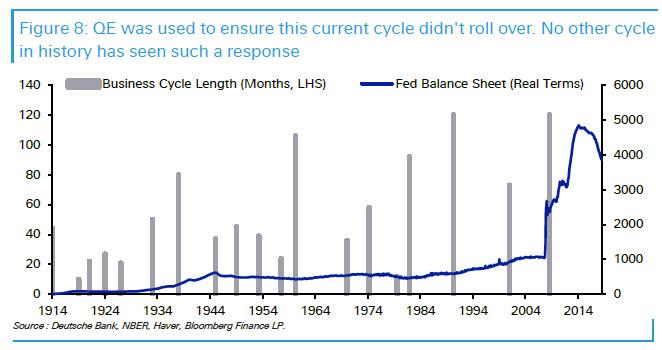
After an economic golden age for the global economy between 1982 and 2008, the Global Financial Crisis was then a huge threat to the era of long business cycles as it exposed the debt-fuelled super-cycle that this policy flexibility encouraged. Allowing a great global debt restructuring that may have naturally occurred as a consequence would have restrained the flexibility of governments and central bankers to manage the business cycle and we could have quickly moved to a world of shorter cycles again. Being at the zero rate bound for the first time in history in many countries
(including the US) compounded the risks. However, as Jim Reid observes “global debt has continued to increase post the GFC and central banks found new weapons – namely QE and negative rates – to ensure that the economies could continue to grow over a period where left to their own devices we may have experienced a more sober economic environment and shorter cycles.”
As such, the US now is on the brink of its longest business cycle on record, continuing the trend of long cycles seen over the last 35-40 years
How long will US business cycles be in the future?
With the last four super-long US cycles attributed to globalization, demographics, downward wage pressures, positive global disinflation, fiat money, increased debt/deficits, and QE, then the answer will come from answers as to how sustainable these trends are.
We’ll skip demographics and globalization as these are slower-acting, tectonic shifts, and focus on topics that are as salient today as ever – especially with another debt ceiling fight looming in D.C. With regards to debt and deficits, if anything the US has moved into an era of higher structural deficits and higher government debt, according to DB. Figure 10 extends the earlier charts to show CBO forecasts for both alongside business cycle lengths historically. Here the conclusion is simple: if the US can maintain such consistent deficits then perhaps it can continue to have long business cycles. Most market participants would likely say that such an increase in debt is not sustainable long term but it could, of course, be sustainable for this and the next business cycle.
Similarly, the era of fiat money won’t be under terminal threat until there is sustained inflation – and not just the hyperinflation recorded in asset prices which the US government and Fed, for some reason, continue to ignore. As such central banks will still have money printing and balance sheet expansion in their armory. Linked into debt and deficits, going forward QE may be used to finance specific government spending more than it has over the last decade where it was used to buy financial assets – particularly government bonds. So this could extend business cycles in the future and is again only likely to be more troublesome for the business cycle length when inflation rises.
So to conclude, retreating globalization and weakening demographics are more negative for business cycle length going forward. However, while we are still able to run large deficits, accumulate more debt, and conduct more money printing we can still manipulate the length of cycles relative to the past. Maybe inflation is the glue here. Once that starts to structurally increase, business cycle management becomes more challenging.
How does this cycle compare to the past
Now that we know how we got here, and to mark the occasion that in just a few hours this will be the longest US cycle on record, let’s take a look at how this cycle compares to previous US cycles through history. Where Deutsche Bank has data, it stretches back to the start of US business cycle tracking in 1854, covering 34 expansions. Where data is missing, the analysis uses yearly data and start the cycle from the beginning of the year in which the recovery started. The titles indicate the periods covered in the graphs.
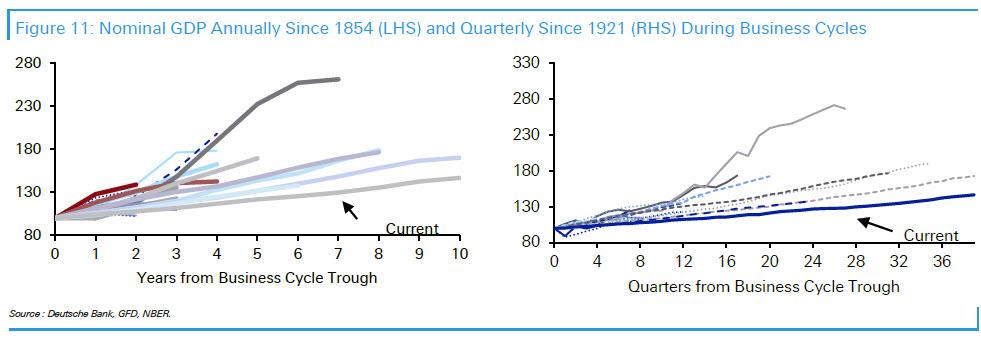
First, we look at nominal GDP. As can be seen from the annual data back to 1854 or the quarterly data starting in 1921, this current cycle has seen the lowest growth at all stages of all the 18 cycles that have lasted more than three years. In fact, that might have helped encourage its longevity as economic activity has not got overly ahead of itself. It took until around 2018 for the output gap from the GFC recession to close and as such we were still in ‘catch-up’ mode for most of it.
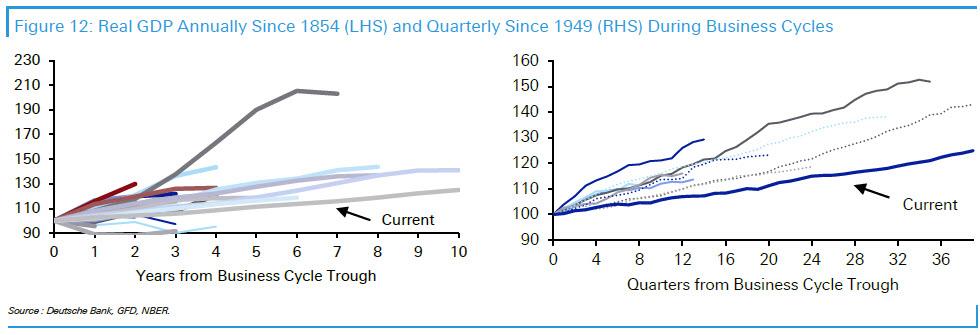
A similar picture emerges in real GDP terms. Using the full annual data series, this is the shallowest recovery of all the 11 that have extended past 4 years. In the quarterly data post-1949, this cycle has been the weakest of any of the 11 expansions at all points through their respective cycles. So perhaps the policy breaks have not been needed to be applied by the authorities in the same manner as in virtually all previous cycles.
Given that population growth in this cycle has been the slowest of all the 34 cycles covered, low nominal and real GDP growth shouldn’t be a surprise. However one could also make the argument that low growth makes recessions more likely as the margin for error is reduced. As such, the longevity of this cycle becomes even more impressive.
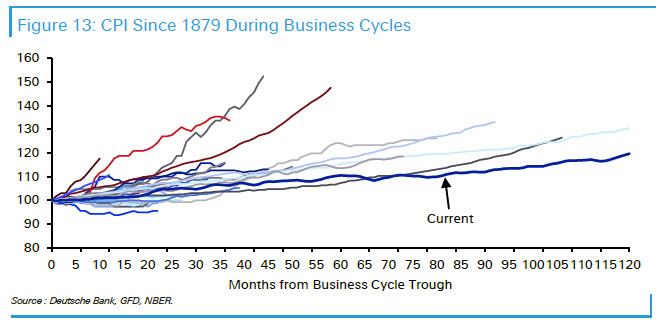
Next, moving to what may be the most critical metric for modern economists – inflation. The early cycles observed covered a period where inflation was structurally much lower. So in this respect, this current expansion looks less extreme on the downside than it does on the growth front. However, the impressive element of this cycle is how steady inflation has been throughout. Indeed prices are only up 18.5% over the now 10-year expansion. This has allowed the Fed to maintain an accommodative policy stance for as long as they have and has helped extend the cycle beyond any other.
At the same time, the decline in unemployment doesn’t look particularly unusual in this cycle relative to the past but the key takeaway from this graph is that recessions tend to start with unemployment still trending down or at least flat lining. It also proves the point that employment is a lagging indicator.

Looking at capital markets reveals an entirely different story.
In terms of equities, this cycle has always been at the upper end of those seen through the entire history back to 1854. As we go past the 1991 expansion – that was previously the longest on record – returns on the S&P 500 are similar to that remarkable cycle which ended with the 2000 stock market bubble bursting. In that cycle, the graph highlights that the equity market peaked in March 2000 before the eventual recession was deemed to have begun in March 2001.
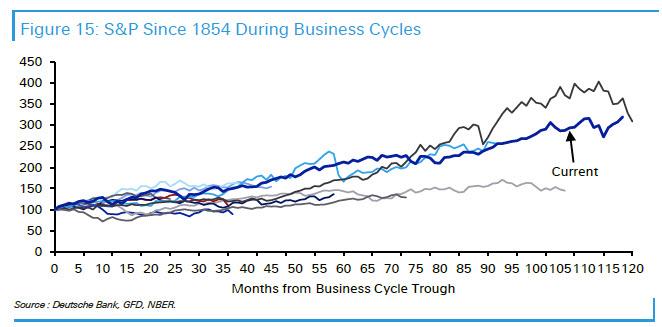
As Deutsche Bank concludes, it’s an interesting paradox that this cycle has consistently been one of the weakest in terms of economic growth but one of the strongest in terms of asset price growth. It also hints at the extraordinary lengths global authorities have gone to ensure this recovery continued. Liquidity and intervention have been enormous and this has flowed into assets, not the economy.
So as we celebrate the longest US expansion in history and the fourth ultra long cycle in a row, the only question worth pondering is what the costs of what as of July 1 will be the longest cycle in history, will end up being?


0 Comments