This article was originally published by Adam Taggart at PeakProsperity.com
Van Halen, M&Ms, And The Next Market Downturn
By Adam Taggart
The planet-sized egos of rock & roll performers are legendary.
Few things symbolize this better than the outrageous requests they often make when on tour.
These requests are referred to as “riders”, and appear in the contract a tour venue receives in advance of the artist’s arrival. These contract riders specify the physical conditions that the singer/band requires to be in place before arriving to perform. Stage lighting settings, sound equipment, furnishings, etc — that kind of stuff.
And these rider requests can get pretty funky – often extremely so — when it comes to backstage perks the performers want.
For example: A wooden pond filled with koi carp (Eminem). A driver who will not speak or make eye contact (Katy Perry). 20 white kittens and 100 doves (Mariah Carey). Seven dwarves (Iggy Pop). 50,000 bees (Slayer). A sub-machine gun (Mötley Crüe). And, yes, even a great white shark (Hank III).
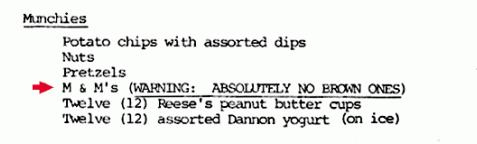
The practice of making these kind of outrageous demands stems from a rider Van Halen inserted into the contract for its 1982 world tour, which insisted on a bowl of M&Ms to be provided backstage, but with all of the brown M&Ms removed.
As this image below of the actual rider shows, the band was very explicit in its seriousness about this:
Once the media got whiff of this, it had a field day roasting the band’s narcissistic chutzpah. A new high-water mark of diva capriciousness had been established, which quickly became legend. A feat of prima donnapampering that subsequent performers have been trying to top ever since.
But as crazy as it sounds, Van Halen’s “no brown M&Ms” rider had nothing to do with caprice. There was a solid rationale behind it.
In fact, it was quite brilliant.
The Importance Of Effective Indicators
Van Halen’s 1982 world tour was a massive production, involving a tremendous amount of gear and technical complexity. The contract the band sent in advance to venues was so thick due to all the details within, it was referred to as the “Chinese Yellow Pages”.
Non-compliance with the requirements in the contract could have serious consequences that could ruin the show, or even jeopardize lives.
So when the band rolled up to its next venue, it needed a quick way to determine if the stage crew there had complied with all of the specifications within its contract.
And that’s why the “no brown M&Ms” rider was inserted. The band could simply hop off the bus and check the candy bowl. If they found brown M&Ms, they knew the contract hadn’t been carefully read. And then they’d immediately call for a full-line check of the entire set.
As lead singer David Lee Roth detailed in his autobiography:
Van Halen was the first band to take huge productions into tertiary, third-level markets. We’d pull up with nine eighteen-wheeler trucks, full of gear, where the standard was three trucks, max. And there were many, many technical errors — whether it was the girders couldn’t support the weight, or the flooring would sink in, or the doors weren’t big enough to move the gear through.
The contract rider read like a version of the Chinese Yellow Pages because there was so much equipment, and so many human beings to make it function. So just as a little test, in the technical aspect of the rider, it would say “Article 148: There will be fifteen amperage voltage sockets at twenty-foot spaces, evenly, providing nineteen amperes …” This kind of thing. And article number 126, in the middle of nowhere, was: “There will be no brown M&M’s in the backstage area, upon pain of forfeiture of the show, with full compensation.”
So, when I would walk backstage, if I saw a brown M&M in that bowl … well, line-check the entire production. Guaranteed you’re going to arrive at a technical error. They didn’t read the contract. Guaranteed you’d run into a problem. Sometimes it would threaten to just destroy the whole show. Something like, literally, life-threatening.
Genius.
Through its rider, the band had created a easy-to-monitor and trustworthy indicator. No brown M&Ms, and the show was likely set up to go smoothly. But if otherwise, don’t perform until the entire venue is scrutinized for other missed requirements.
The lesson to take from Van Halen’s wisdom is that having good indicators is key to achieving success.
This is also extremely true for the world of investing, where you are deploying capital based upon an expected future return. How do you determine when it’s a good time to enter into an investment? Once in it, how do you monitor the conditions supporting your rationale for holding it — are those changing? And if so, are they getting better or worse? When should you exit the position?
For all of these questions, the better the indicators you use, the more accurate and informed your decision-making will be. And the better your returns as an investor will be.
When The Indicators Are Giving A Signal, Pay Attention
Over the years, we’ve compiled a large number of indicators that we monitor closely on an ongoing basis here at PeakProsperity.com. They most definitely inform our economic outlook and forecasting.
We’ll dedicate an upcoming report to laying out the sources and metrics we place the greatest weighting on. But several that we’re watching closely right now come from two market analysts that we highly respect.
The first set comes from Lance Roberts, chief strategist/economist for Clarity Financial. Lance is renowned for his excellent charts and ability to highlight key changes in data trends. Below are several indicators he’s recently featured, suggesting weariness in the US financial markets and growing likelihood of economic recession.
First, the S&P 500 is showing signs of topping out, having broken below the trading range of its latest 8-month bullish trend, and its MACD momentum indicator displaying two recent sell signals:
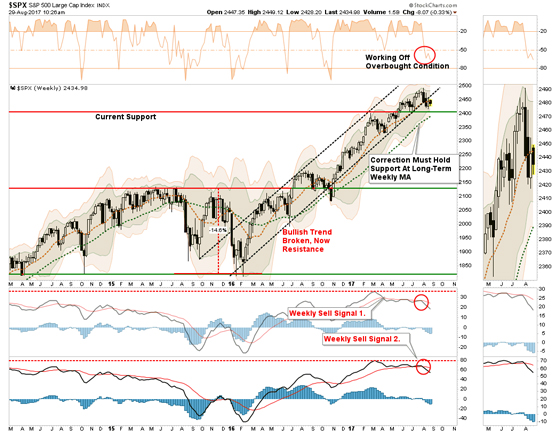
Lance warns that such signals suggest that further price gains will be “volatile and limited” unless the S&P returns into its bullish channel. If it indeed does not and drops below the key resistance level of 2390, he sees a swift price correction of 12% as a real possibility.
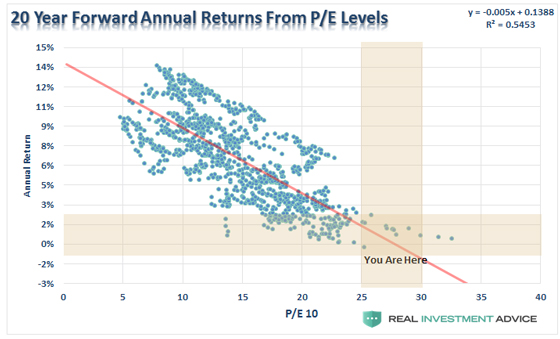
But he then combines this near-term technical analysis with more far-sighted data to make the point that the financial markets are not just overbought, but dangerously overvalued at this point. Similar to John Hussman(another producer of market indicators we value highly), Lance shows that, because today’s prices are the result of pulling so much of tomorrow’s valuation into today (e.g., via the suppression of interest rates and overexuberant speculation), we are living at a rare time in history where the average market return for the next 20 years may well be negative:
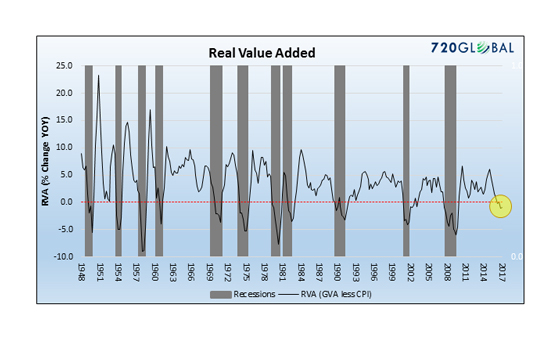
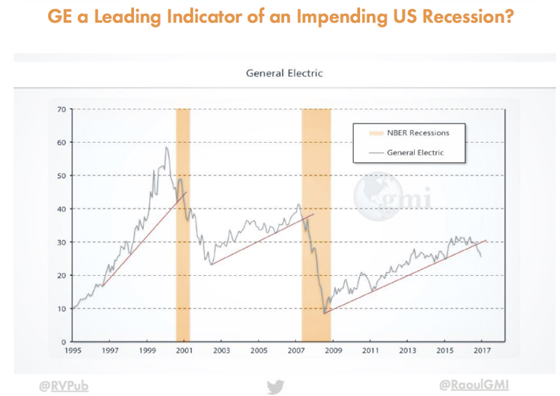
And he recently caught our attention by surfacing this chart of the change in annual Real Value Added to the US economy, a metric that hadn’t been on our radar beforehand. This has been a reliable indicator of recession in the US for nearly 70 years, and is now signaling that we’ve likely already entered one:
Couple Lance’s indicators with those of our other expert, Grant Williams, portfolio advisor at Vulpes Investment Management and co-founder of Real Vision TV. Grant and the team at Real Vision recently issued their latest Killer Charts series, which adds validation and additional weight to Lance’s warnings.
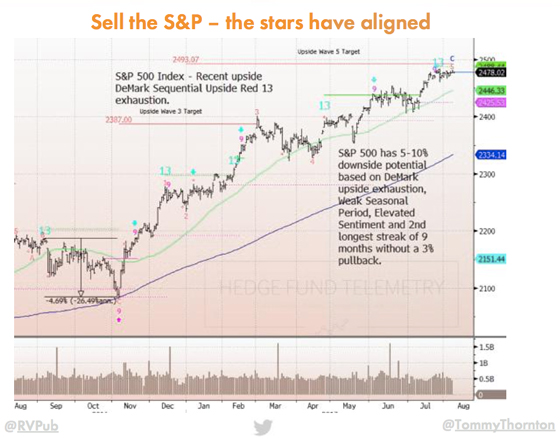
First off, Grant and his team see similar technical signs of “exhaustion” in the S&P 500 and predict lower prices ahead:
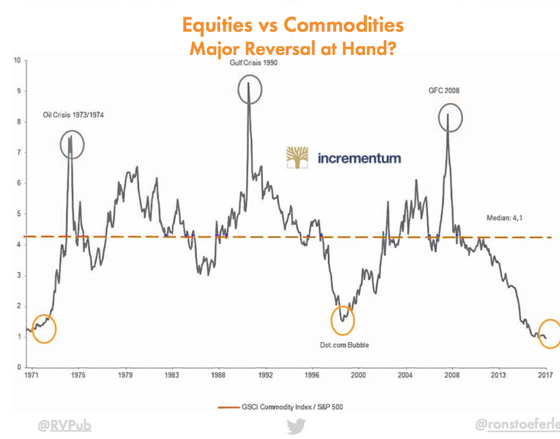
Note that they don’t just expect the S&P to correct slightly and then continuing powering higher. Other indicators they track, like the equities-vs-commodities ratio, strongly suggests a bubble peak for the S&P. From here they predict a secular bear trend for stocks (possibly paired with a new bull trend in commodities):
And like Lance, Grant sees signs that the US economy is poised to slow further…
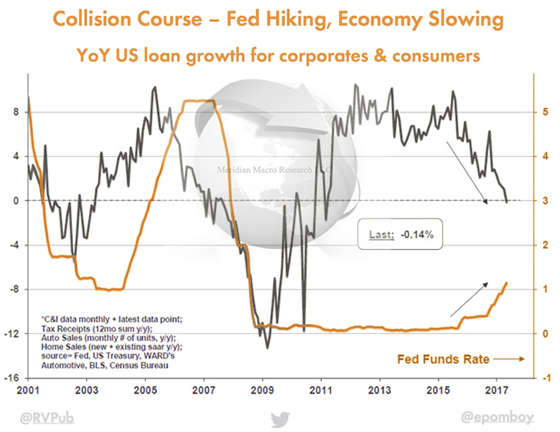
.. and is likely, as Lance also concludes, tipping into recession:
When smart analysts independently find the same patterns in the data, it’s time to take notice.
The charts above are only a few of the indicators Lance and Grant monitor that are now sending strong cautionary warnings about the near-term prospects for the financial markets and the underlying economy. What other key metrics should we also be tracing closely right now?
To dig much deeper into this, Lance and Grant will be presenting their latest indicators, analysis and forecasts at the Dangerous Markets webinar on September 13th — where they will take ample questions live from the audience. For more information on the webinar, click here.


0 Comments