This article was contributed by James Davis with Future Money Trends.
Intuitively, you understand it. Your gut is telling you that silver HAS HAD a great run. You’re just looking for ANY CONFIRMATION that this rally might last JUST A BIT LONGER so you don’t miss out on gains. You’re looking at data and you understand HOW HISTORIC the month of July and the first week of August trading have been, but YOU STILL WANT MORE.
July has been UNPRECEDENTED. We may never see anything QUITE LIKE IT.
Silver might give back some of these gains, but I’m NOT SELLING ANY yet. As remarkable as July and August have been, silver DOESN’T STOP these types of bull markets in this fashion – nothing is over yet.
Take a look:
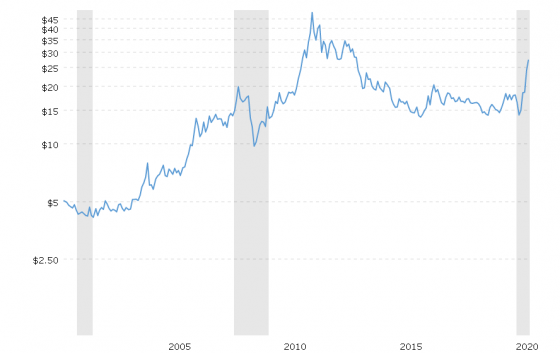
Courtesy: Macrotrends.net
When silver moves, IT REALLY MOVES, and we’re in one of those time vortexes where it is making headway in warped speed – it can still DOUBLE from here.
Before it does, though, it can consolidate until the end the year between the $25 and $30 range, barring any PRESIDENTIAL UPSET in November or an unanticipated COVID-19 panic.
After that, it will gain MORE STEAM and will push upwards with SHEER FORCE towards $45/ounce. It’s QUITE IMPOSSIBLE to time these since market madness is illogical. In my career, I’ve made FAR MORE MONEY by simply getting the BIG PICTURE right, sitting on MY ASS and letting the cycle play out than by trying to be the genius that times the day-to-day activity.
Look at the chart of silver above, which is 20 years long and dates back to the year 2000. You’ll notice that when silver had its FIRST BIG MOVE in 2003, it gained 170% in just short of three years.
The price doubled between 2009 and 2011 and then rose by 60% and then by another 60%, TOTALING a move from $9/ounce to $49 in LESS THAN TWO YEARS – when it moves, IT REALLY MOVES.
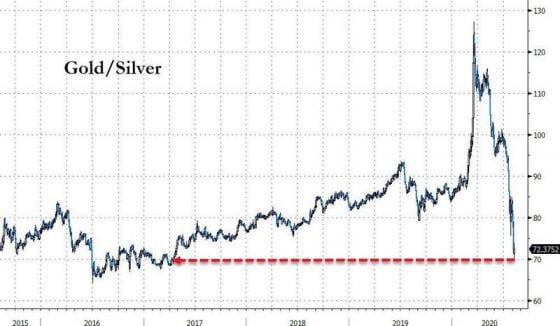
Courtesy: Zerohedge.com
About a week ago, I said that when the GOLD/SILVER ratio closes in on its December 2015 level of 65:1, we’ll have confirmation that the precious metal bull market HAS MATURED.
We’re not there yet, and it looks like CROSSING IT will be a struggle, as it should be.
In war, some battles are more important than others. Some overlooking hills give the enemy such AN ADVANTAGE that we’ll DO ANYTHING to conquer them. Some snipers are so well-hidden and they cause so much damage that a whole platoon is sent to take down JUST ONE PERSON.
The lesson here is that the more time it takes to CHEW THROUGH all the sellers that will appear in the coming weeks and months, the sweeter the victory will be WHEN THEY SURRENDER.
Therefore, I say it UNEQUIVOCALLY: I’m not selling my mining shares or physical metals since ANY EFFORT and every bit of energy spent in attempting to time this trade is A WASTE when my focus should be on how to earn more money in my businesses, so I can put it towards BUYING the DIPS.
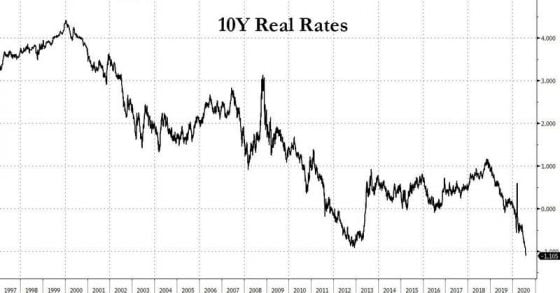
Courtesy: Zerohedge.com
If you’re BETTING HEAVILY on higher precious metal prices, this is the one chart that matters. If you FLIP IT upside down, it will look exactly like the gold chart.
I’m going to SHOCK YOU to the core with two new ideas on how to POSITION FOR MASSIVE PROFITS!
Make sure to CHECK your inbox for OUR ALERTS!!


0 Comments